
Informationsvisualisierung und Visual Analytics
Sitzung 1 – Einführung
Wintersemester 2026/27 · Medien- und Bildungsmanagement (MBM)

Übersicht
- Organisatorisches
- Themen und Ziele
- Literaturempfehlungen und weitere Quellen
- Einführung: Visualisierung und verwandte Gebiete
Präsenz vs. hybrid vs. online
So findet die Veranstaltung statt
Gemischtes Format
Mischung aus Präsenzterminen und Online-Treffen
Nicht hybrid
Kein explizit hybrides Konzept!
Nur im Notfall
Eine hybride Zuschaltung ist derzeit nur eine „Notlösung“
Digitale Kommunikations- und Kollaborationswerkzeuge
Die Vorlesung mischt Präsenztermine und virtuelle Treffen. Diese Werkzeuge setzen wir ein:
Moodle
Bereitstellung der Lernmaterialien
Slack
Asynchrone Kommunikation
Zoom
Synchrone Online-Treffen
Zugang zu Moodle und Slack
Moodle-Kurs
Zentraler Ort für alle Lernmaterialien der Vorlesung
- Kurs: Informationsvisualisierung und Visual Analytics (WS 2026/27)
- Einschreibeschlüssel: wird in der ersten Sitzung bekanntgegeben
Slack-Workspace
Workspace zur Veranstaltung
- Einladungslink: im Moodle-Kurs
Prüfungsleistung für MBM-Studierende
Projekt aus einem der beiden Bereiche
- Ausgangspunkt: eine Forschungsfrage
- Eigenständig durchgeführtes (kleines) Forschungsprojekt, das die Themen der Veranstaltungen aufgreift
- Designbasierter Ansatz
- Empirische Elemente
Präsentation der Ergebnisse
Als Posterbeitrag – nach den typischen Einreichungsformaten wissenschaftlicher Konferenzen
Handreichung
Handreichung zur Prüfungsleistung M1 (V1.1)
Zu finden im Moodle-Kurs „Studieninformationen BA und MA MBM“
Themen und Ziele der Vorlesung (1)
Grundlagen & Prinzipien
- Verständnis der Ziele, Prinzipien und Aufgaben der Informationsvisualisierung
- Zusammenhang von Daten, Information und Wissen
- Wahrnehmung und Kognition als Basis visueller Gestaltung
- Bedeutung von Nutzenden, Aufgaben und Kontext
- Überblick über den Visualisierungsprozess – von der Datenerhebung bis zur Interaktion
Qualität & Gestaltung
- Anwendung der Kriterien Expressivität, Effektivität und Ästhetik
- Kenntnis typischer Visualisierungsansätze und -techniken mit deren Stärken und Grenzen
- Überblick über fortgeschrittene Verfahren (multidimensional, hierarchisch, netzwerkbasiert)
- Kritische Analyse und Bewertung bestehender Visualisierungen
Themen und Ziele der Vorlesung (2)
Entwicklung & Umsetzung
- Auswahl geeigneter Visualisierungsverfahren für konkrete Datensätze
- Eigenständige Entwicklung von Visualisierungslösungen und -techniken
- Umsetzung interaktiver Visualisierungen mit Tools wie Tableau, D3.js, Vega-Lite
- Gestaltung aussagekräftiger Infografiken
KI-basierte Erweiterungen
- Rolle von KI im Visualisierungsprozess (Mustererkennung, Clustering, Anomalieerkennung)
- Nutzung KI-gestützter Systeme (z. B. Chat-basierte Analyse, Natural-Language-to-Visualization, KI-Dashboards)
- Einsatz und kritische Reflexion generativer KI-Tools (Copilot, ChatGPT, Gemini …) zur Datenexploration und Code-Erstellung
- Reflexion ethischer und gestalterischer Aspekte: Transparenz, Bias, Verantwortung
Literatur
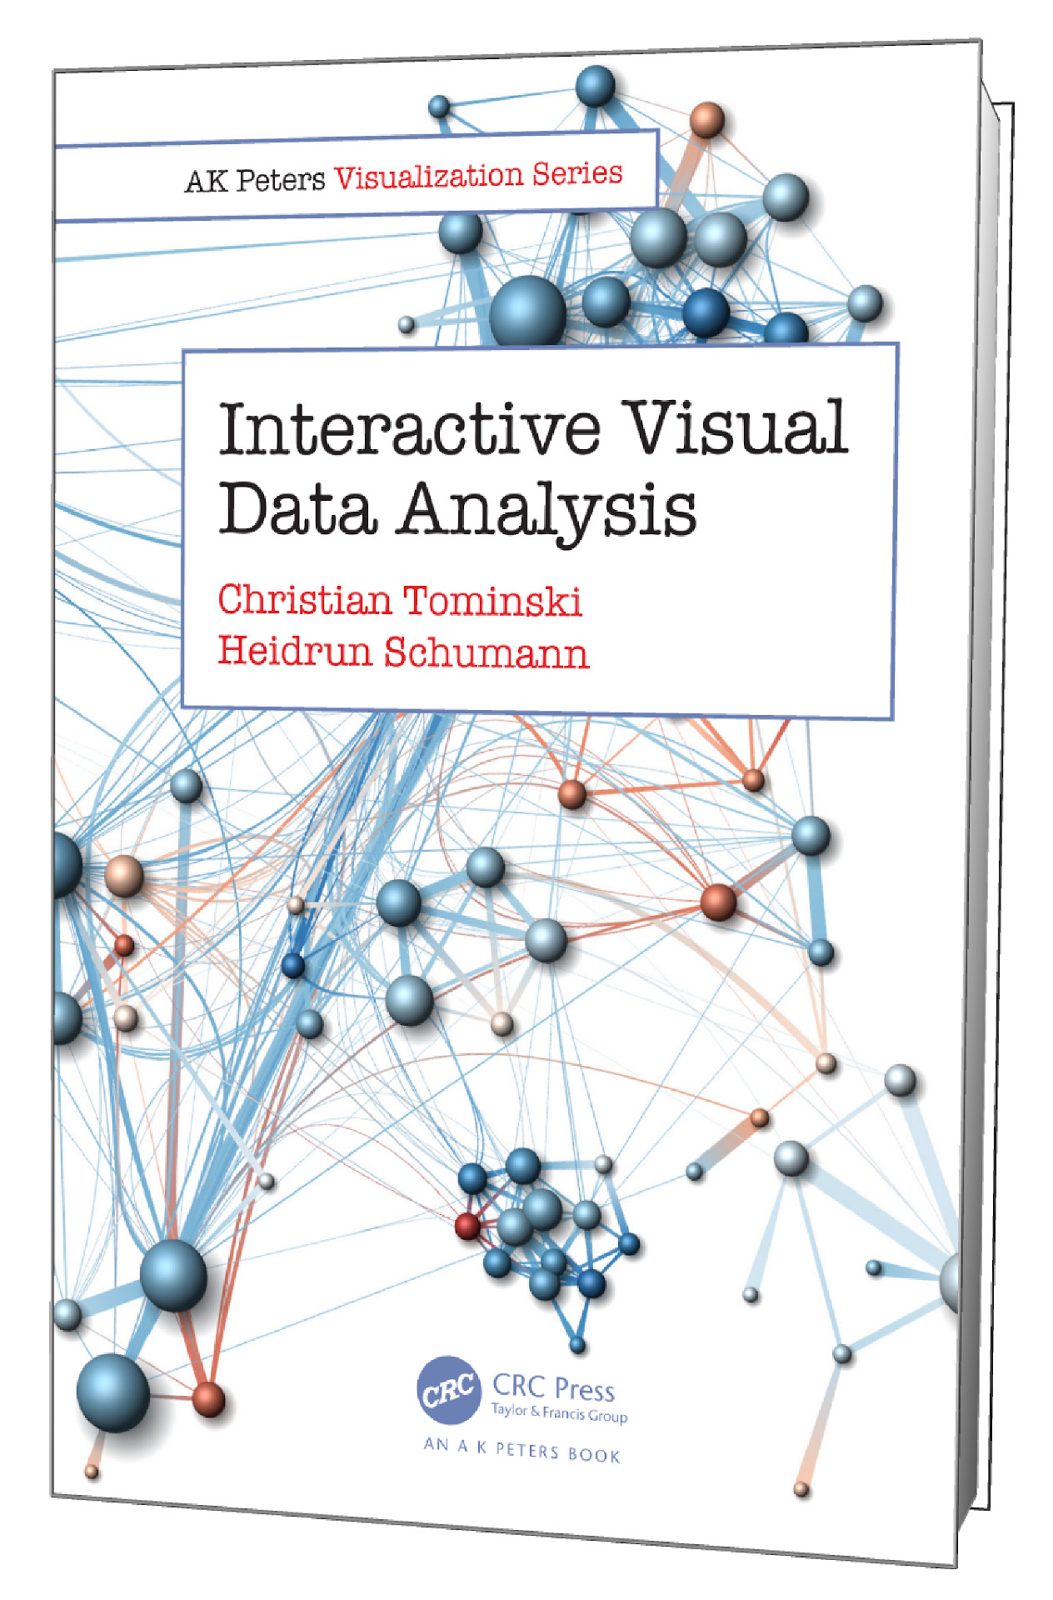
Lehrbuch zur Vorlesung
Christian Tominski & Heidrun Schumann (2020)
Interactive Visual Data Analysis
AK Peters Visualization Series / CRC Press
Weitere Materialien
Weitere Materialien im Moodle-Kurs
Lehrvideos & Folien
Selbstlernmaterialien
Aufgaben
Reader
Weitere Materialien
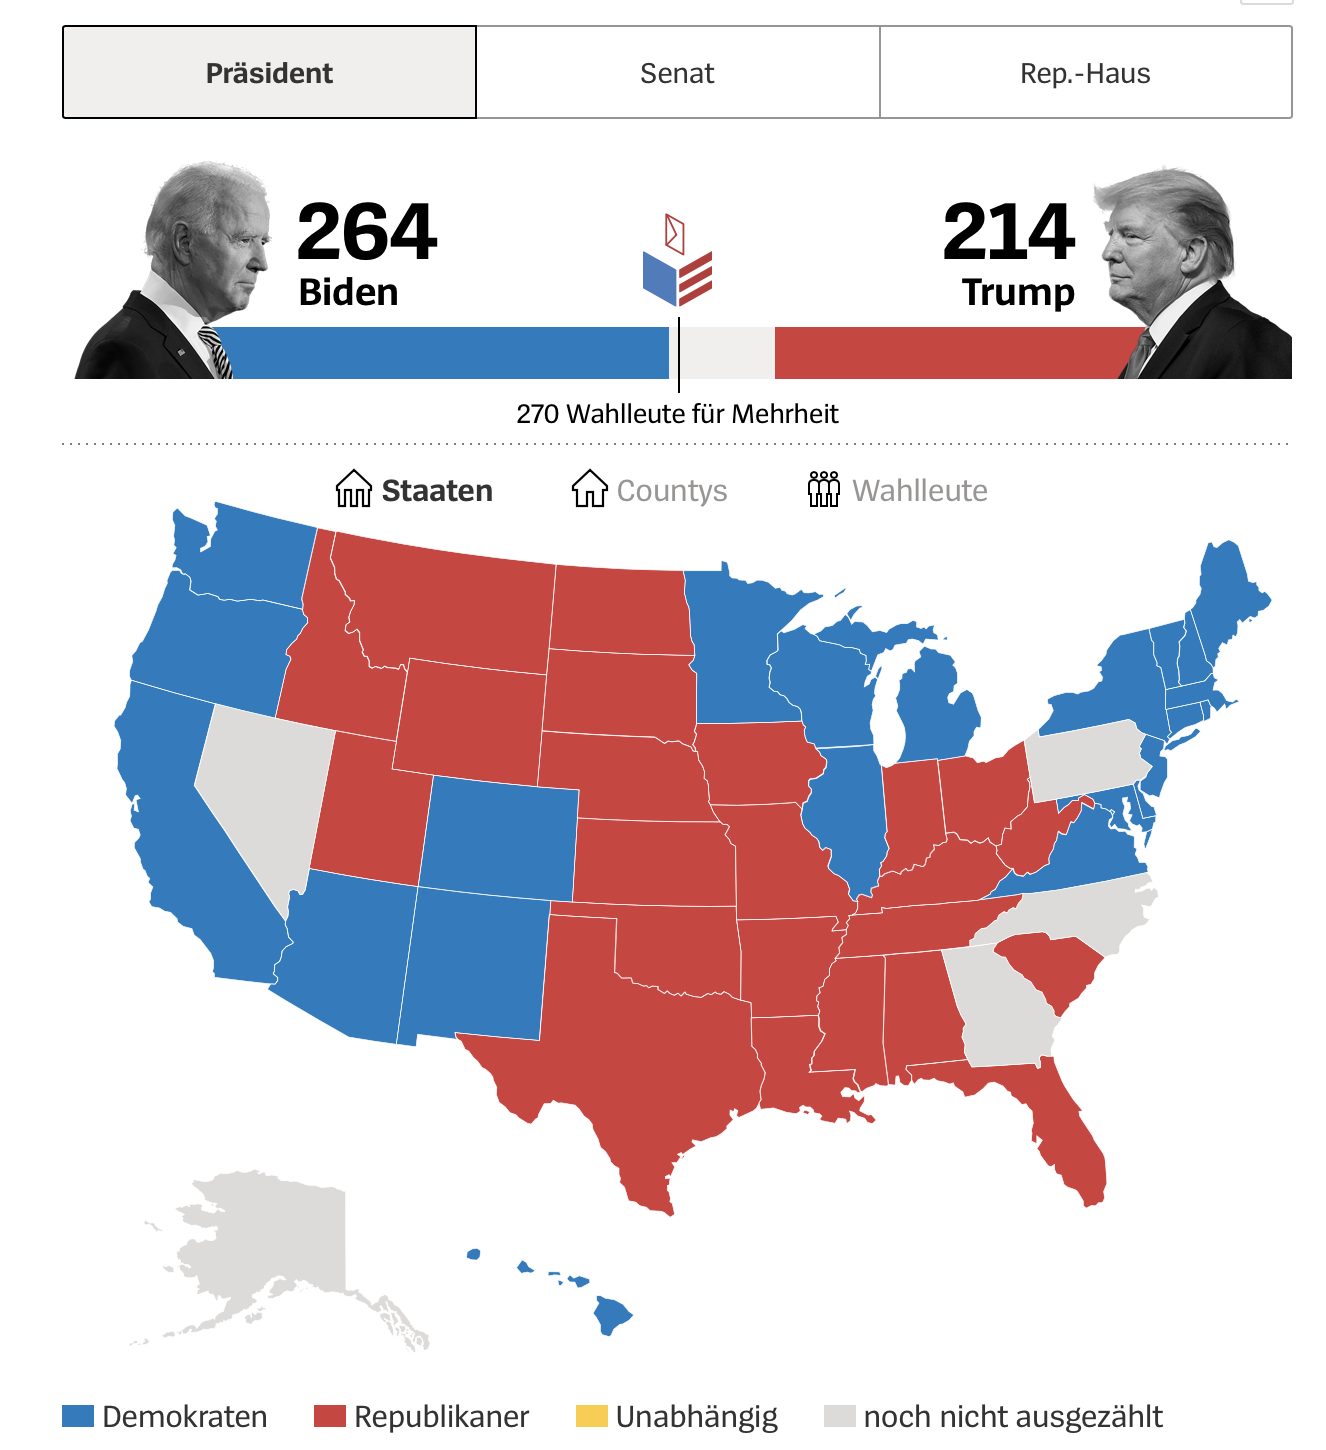
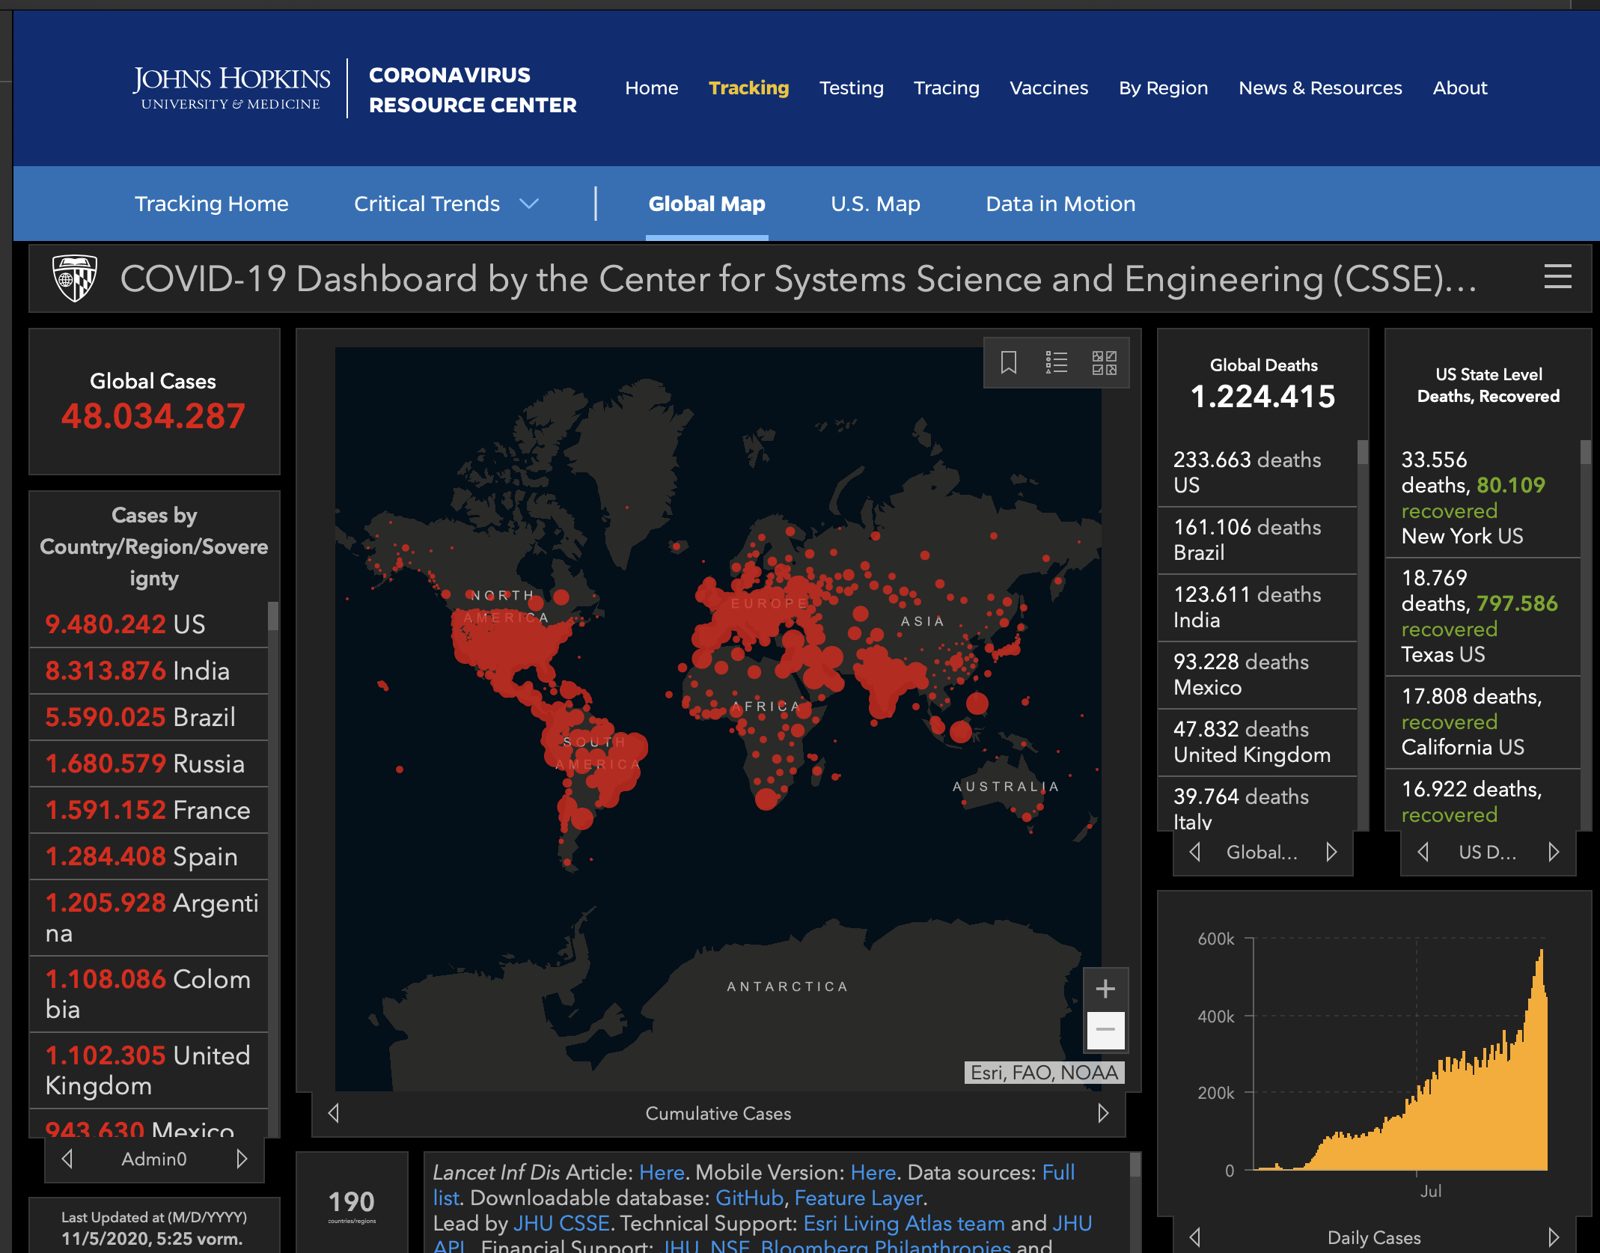
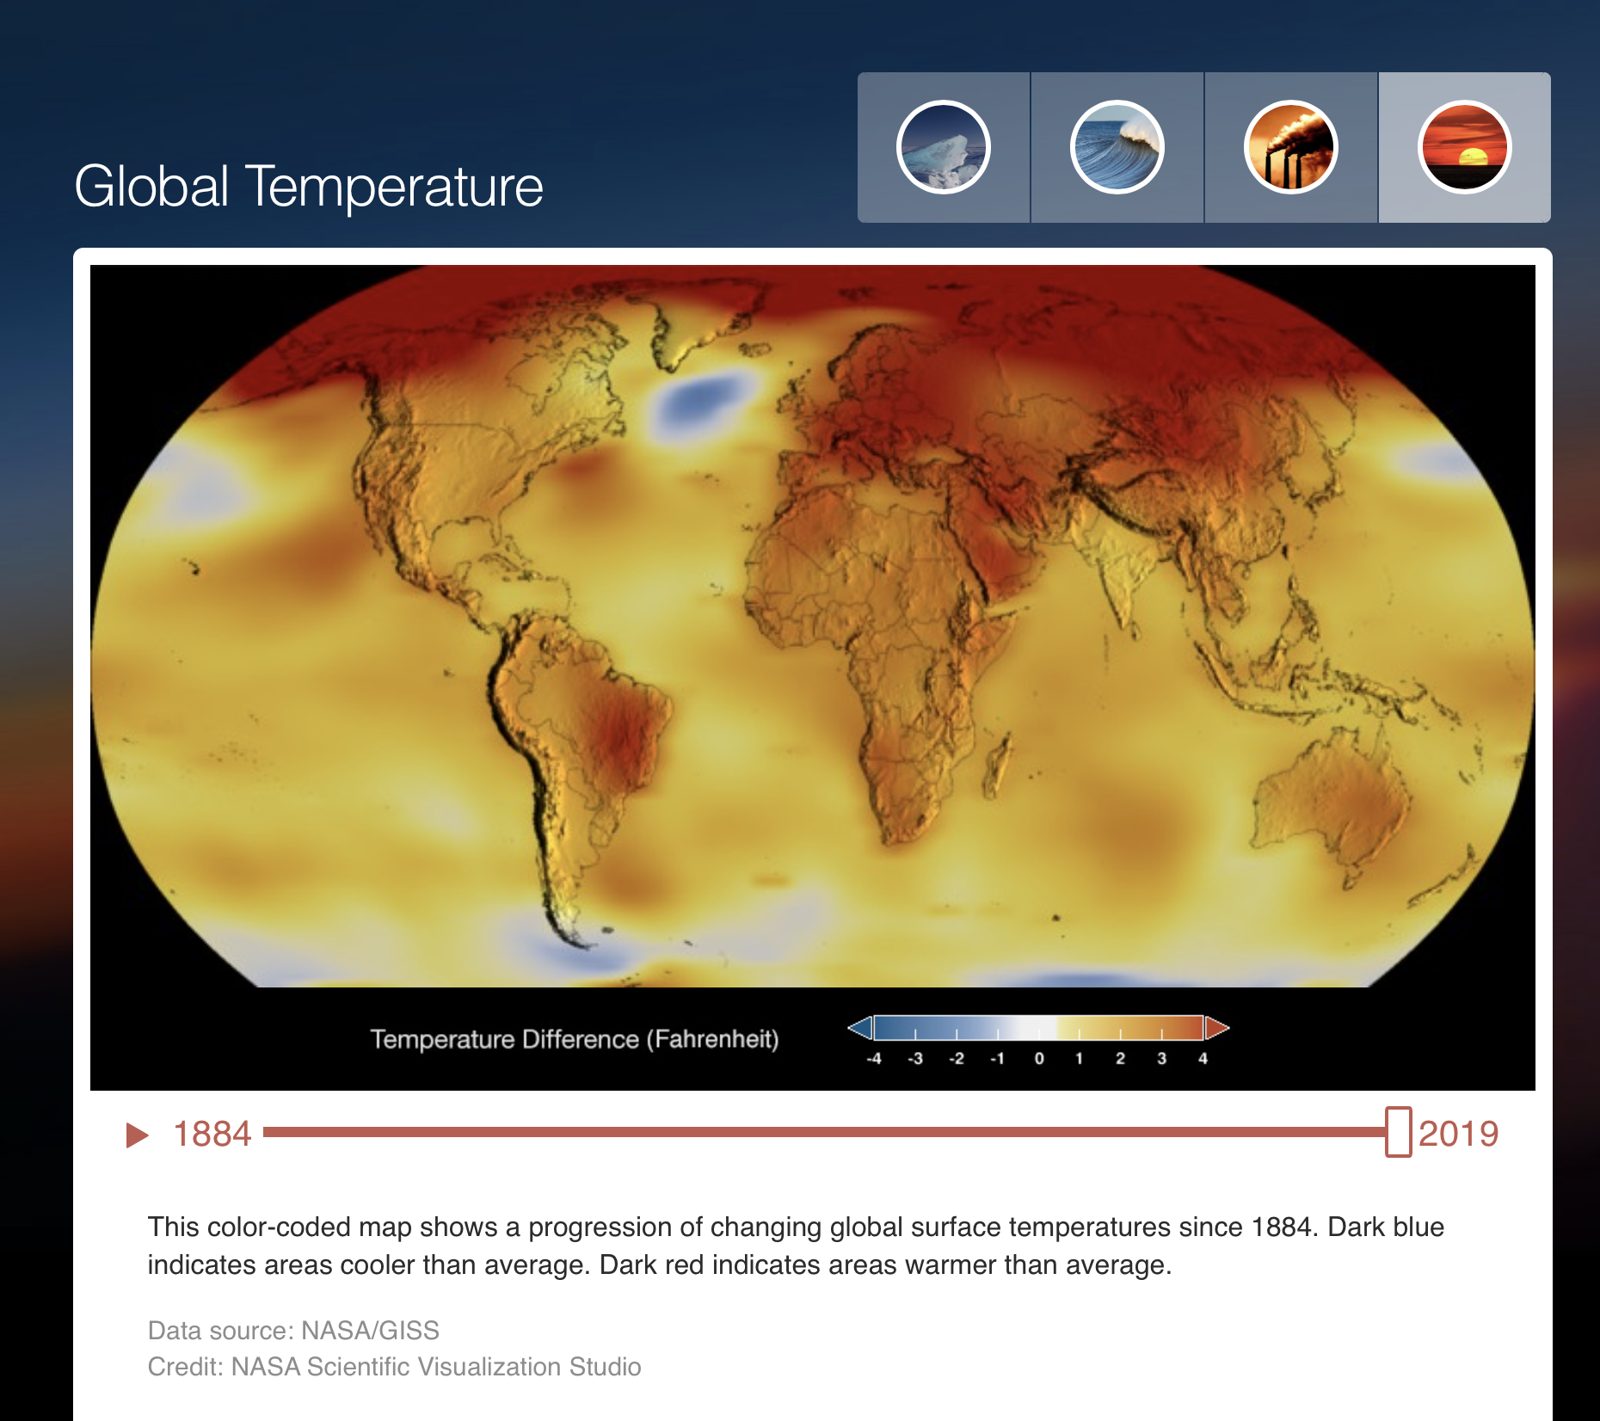
Visualisierungen im Alltag
Motivation: Big Data (1)
In immer mehr Anwendungsbereichen werden Daten gesammelt – die Informationen in Datenbanken und globalen Netzen (z. B. WWW) wachsen immens.
- Megabyte (10⁶)Inhalt eines Buches (1 MB)
- Gigabyte (10⁹)Inhalt einer Buchhandlung (1 GB)
- Terabyte (10¹²)Typische Universitätsbibliothek (1 TB) · Library of Congress (20 TB ohne Bilder) · Kmart-Kundendatenbank (460 TB, 2004)
- Petabyte (10¹⁵)Bank of America (1,5 PB, 2008) · eBay-Kundendatenbank (5 PB, 2008)
Motivation: Big Data (2)
- Petabyte (10¹⁵)Twitter: 400 Mio. Tweets pro Tag¹ · YouTube: 800 Mio. Nutzende pro Monat¹ · Facebook: 10 PB Logdaten pro Monat²
- Exabyte (10¹⁸)Google: 24 PB pro Tag¹ bzw. 8,8 EB pro Jahr
- Zettabyte (10²¹)Weltweites Datenvolumen (erzeugt, gesammelt, kopiert): 1,82 ZB 2011³ · 42 ZB 2020⁴ · 149 ZB 2024⁴ · 390 ZB 2028⁴
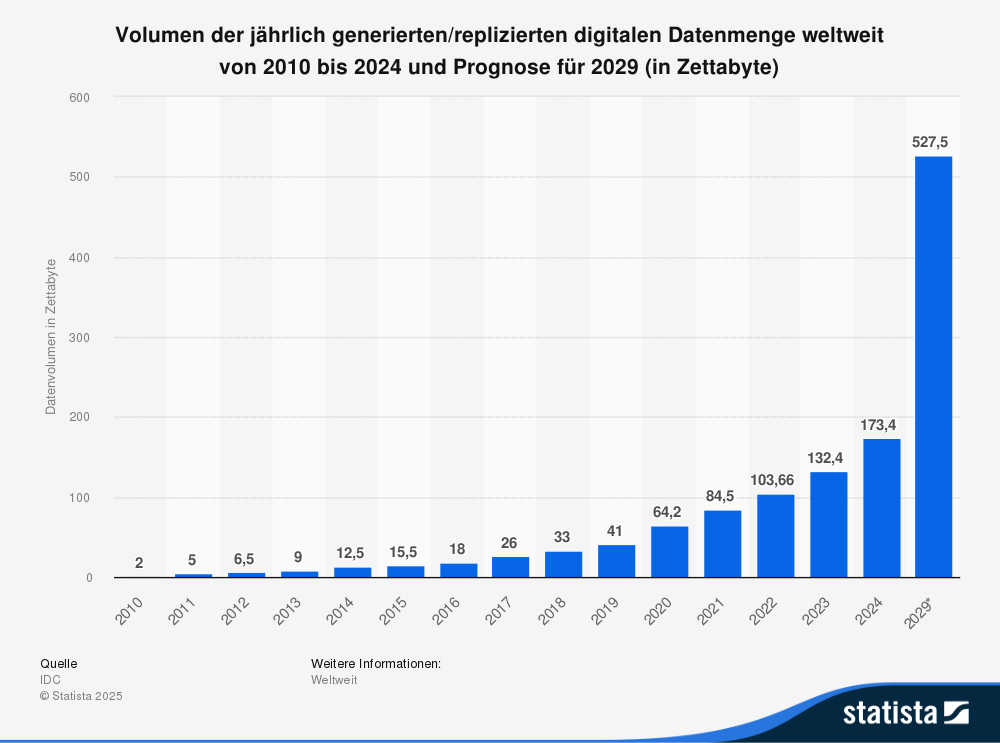
Quelle: statista.com, 2025
¹ Mainzer 2014 · ² Padgavankar und Gupta 2014 · ³ Gantz und Reinsel 2011 · ⁴ statista.com
Visualisierung
“The depiction of information using spatial or graphical representations, to facilitate comparison, pattern recognition, change detection, and other cognitive skills that make use of the visual system.”Hearst, 1998
 →
→
→
→
Visualisierung
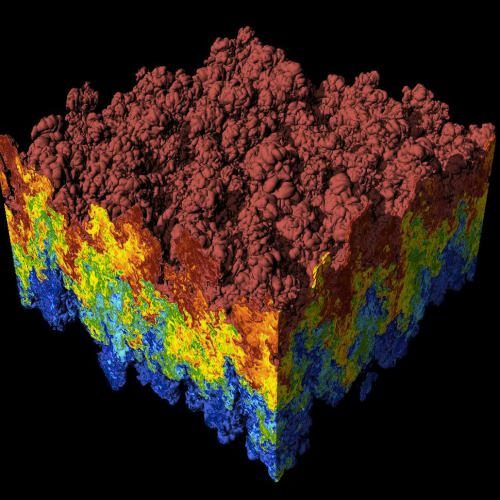
“Visualization is a method of computing. It transforms the symbolic into the geometric, enabling researchers to observe their simulations and computations. Visualization offers a method to see the unseen. It enriches the process of scientific discovery and fosters profound and unexpected insights.”McCormick et al., 1987
Informationsvisualisierung
“The use of computer-supported, interactive, visual representations of abstract data to amplify cognition.”Stuart K. Card, Jock Mackinlay & Ben Shneiderman (1998)
Visual Analytics
Ansätze und Methoden, um Erkenntnisse aus extrem großen und komplexen Datensätzen zu gewinnen – auf Basis von
Visualisierung
Automatischer und KI-gestützter Analyse
Interaktionsmechanismen
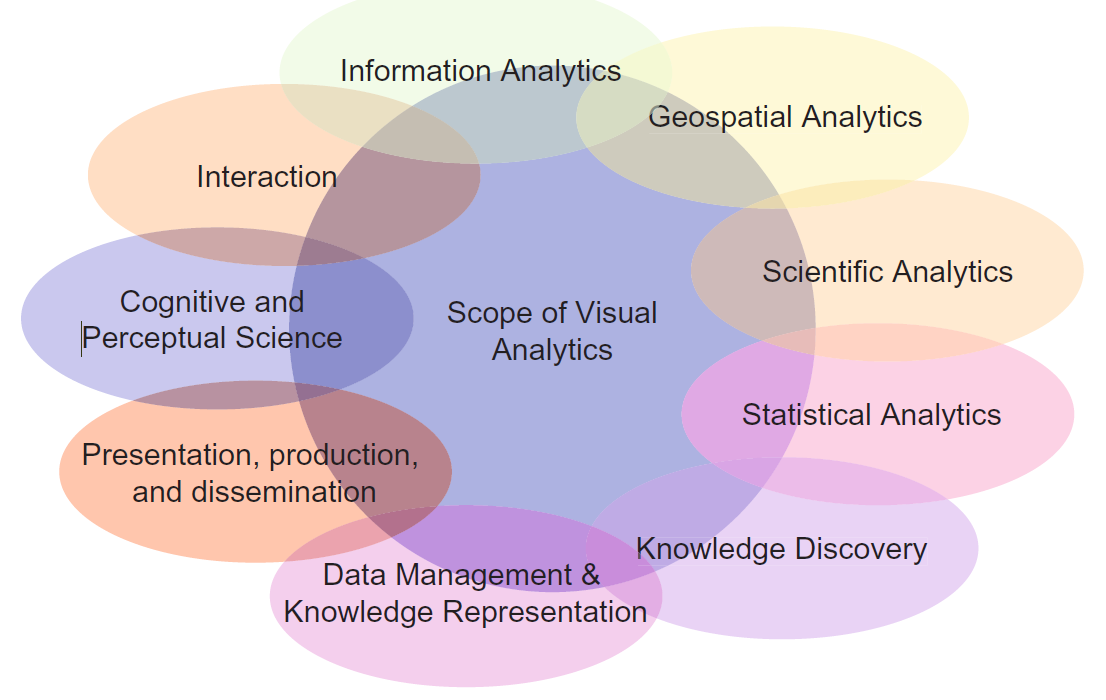
Keim et al. (2008): Visual Analytics: Scope and Challenges (Wikipedia)
Klassische Diagrammformen
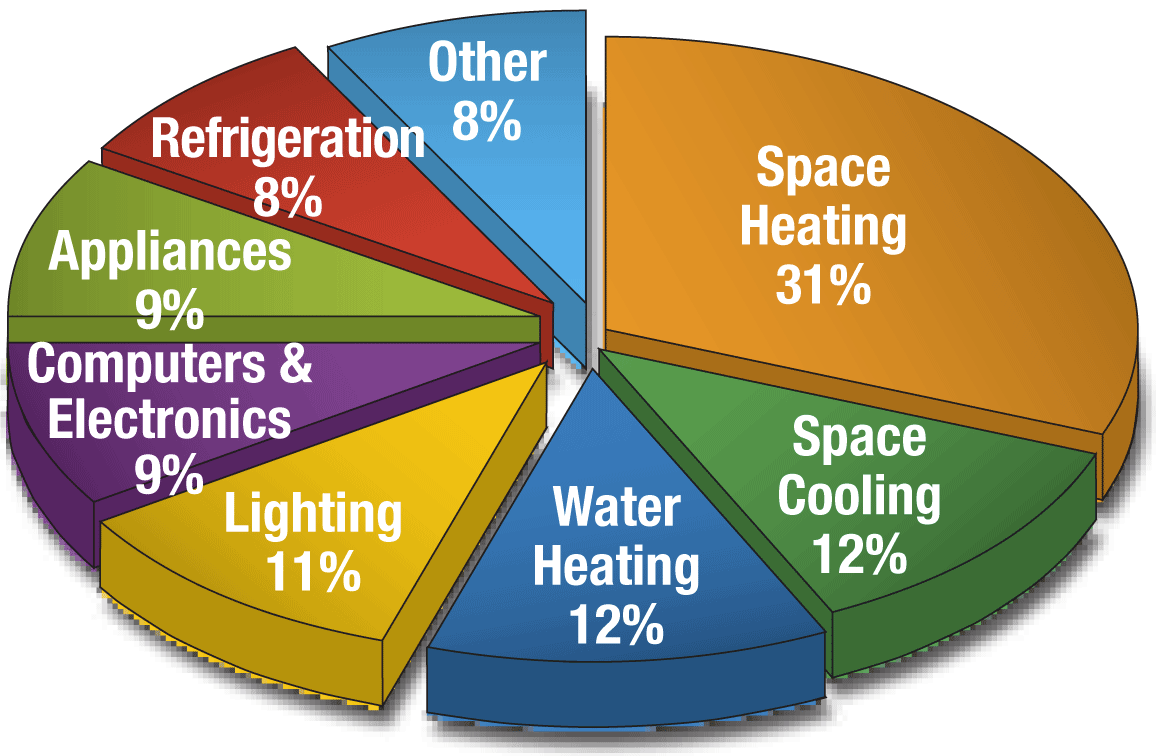
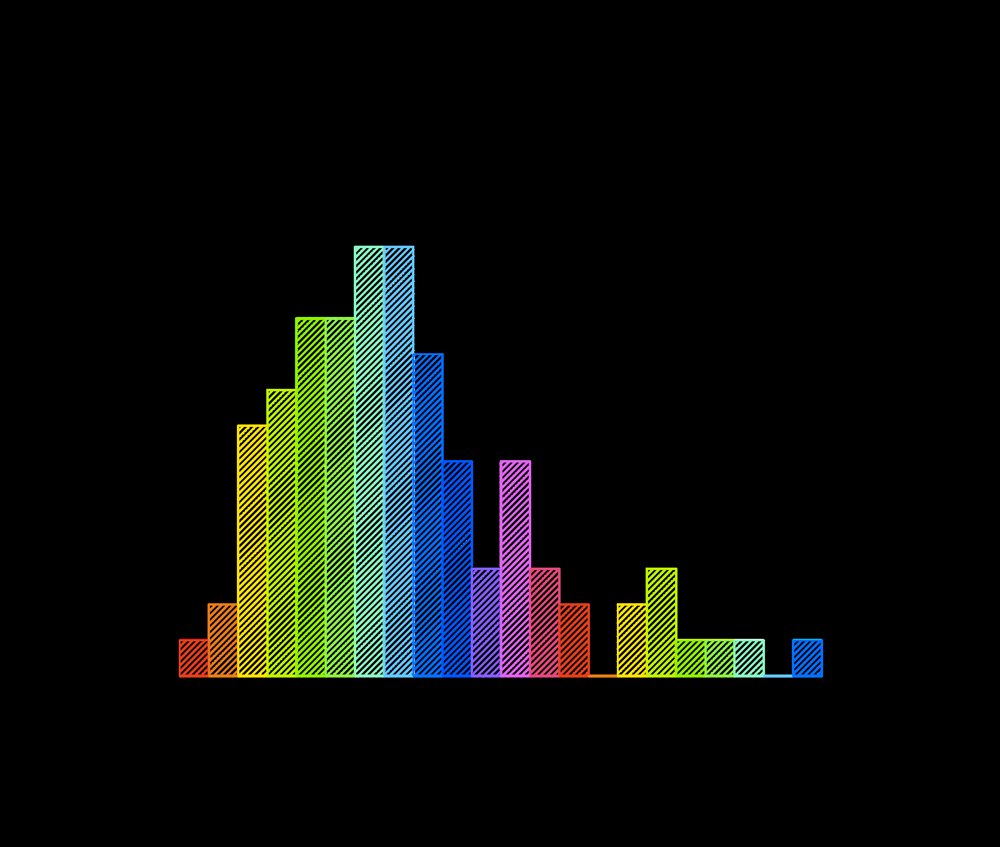
Penfield 2010, Wikipedia
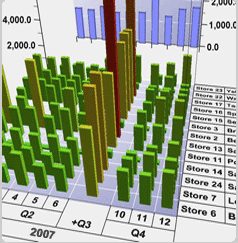
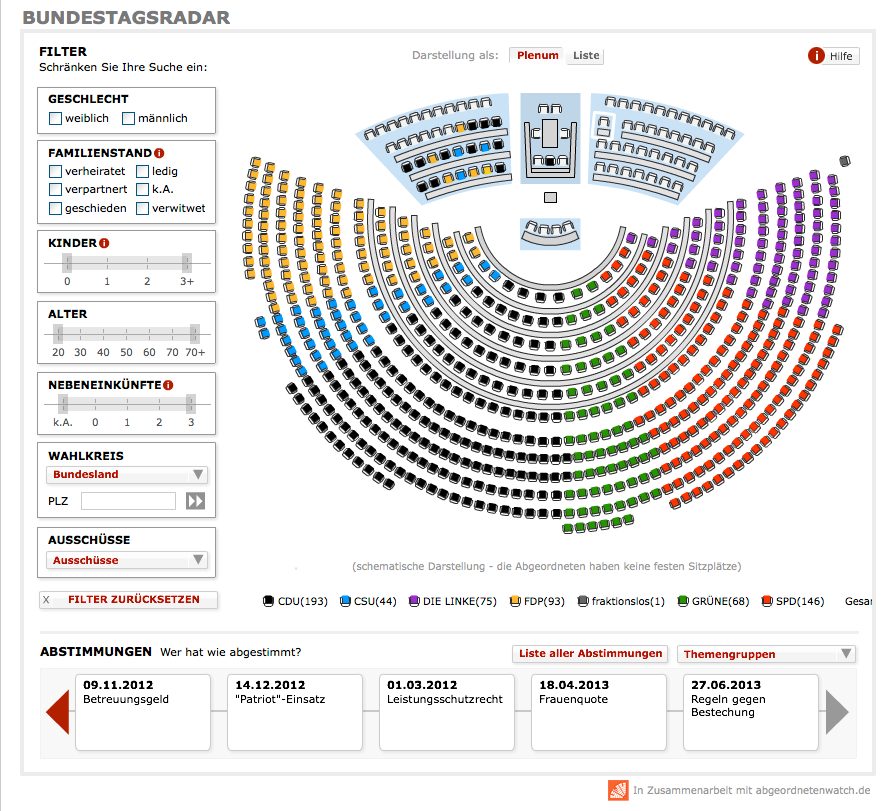
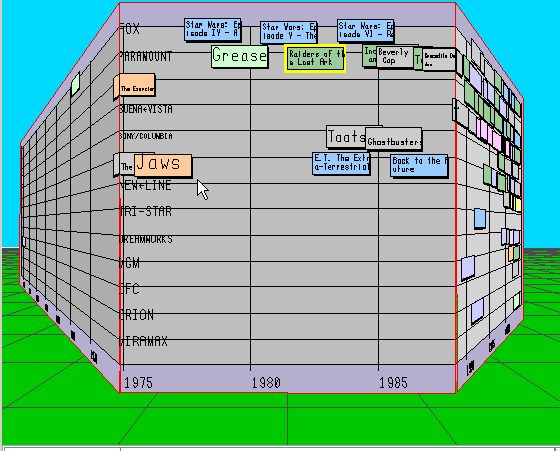
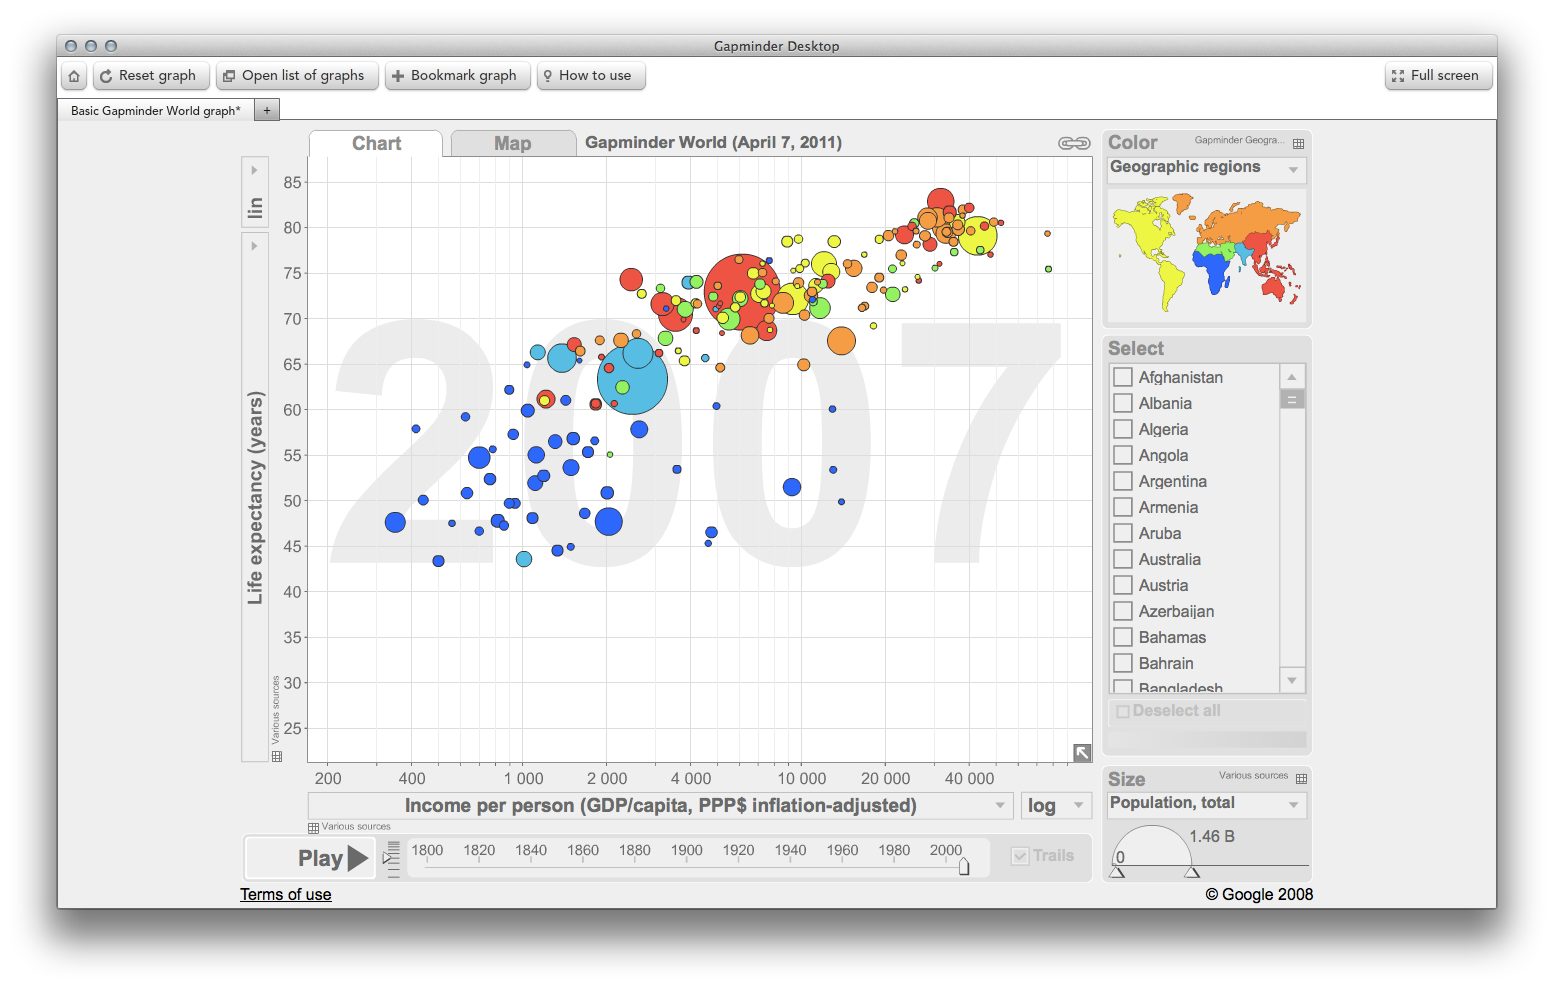
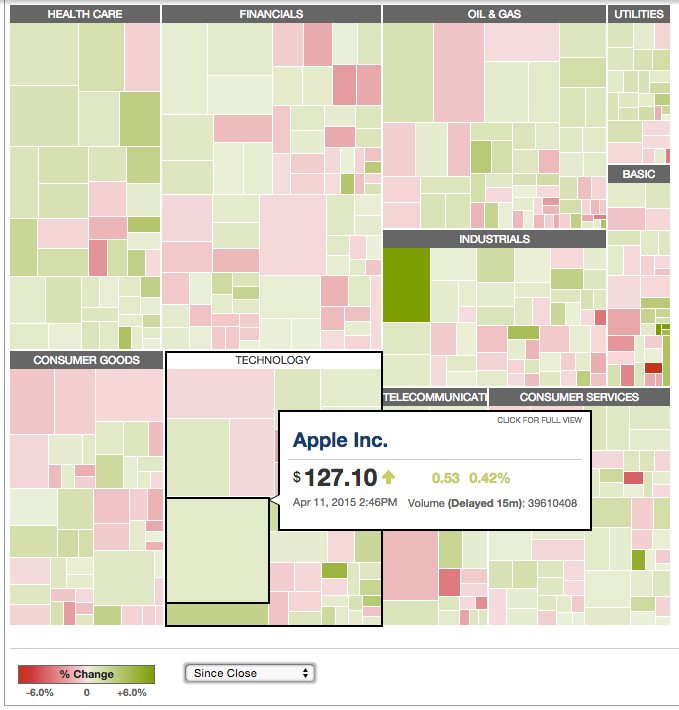
Beispiele interaktiver Visualisierungen
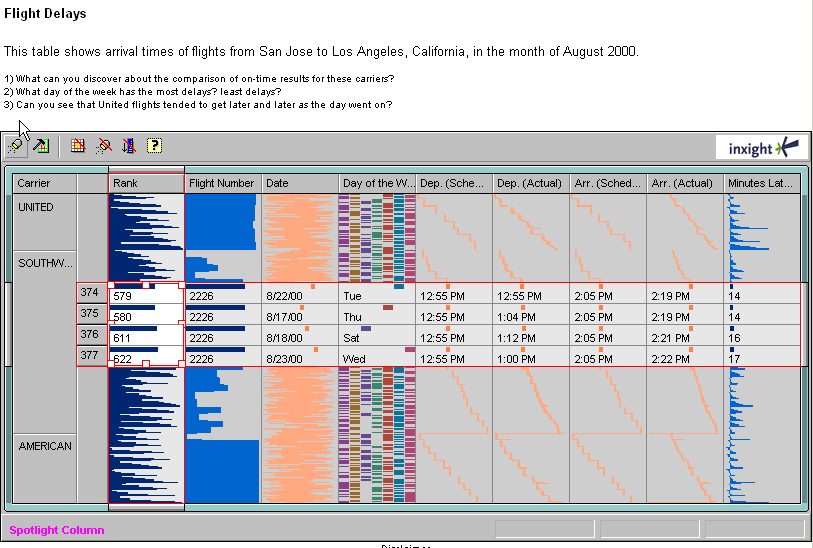
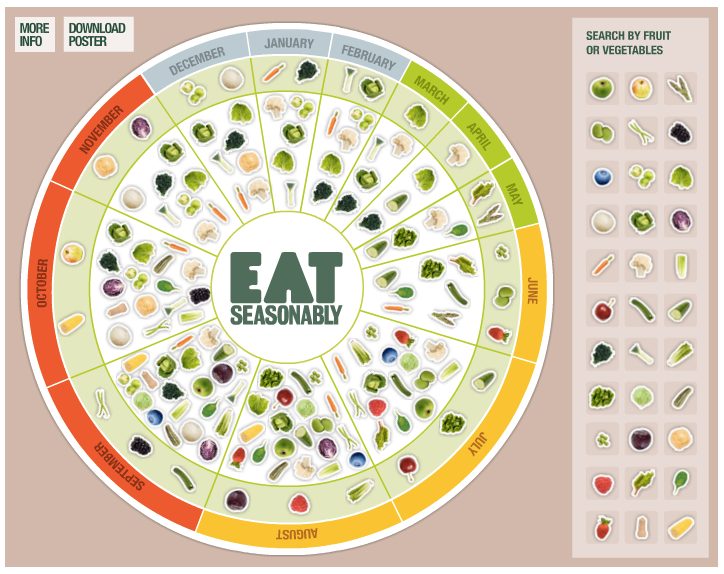
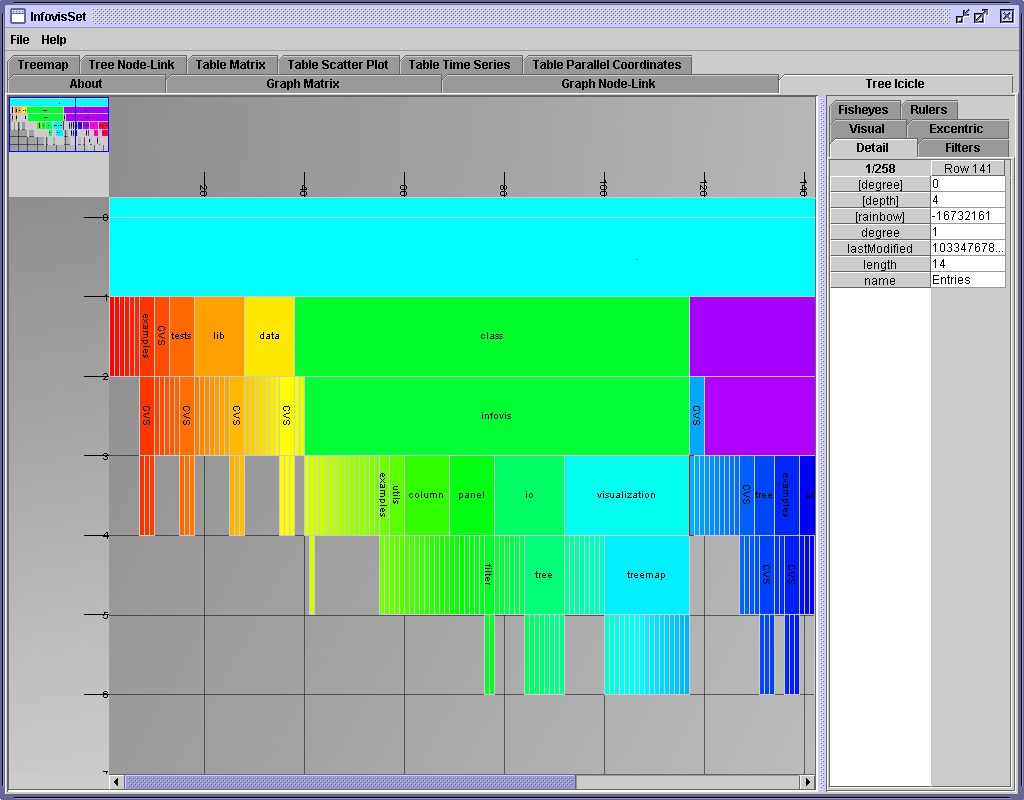
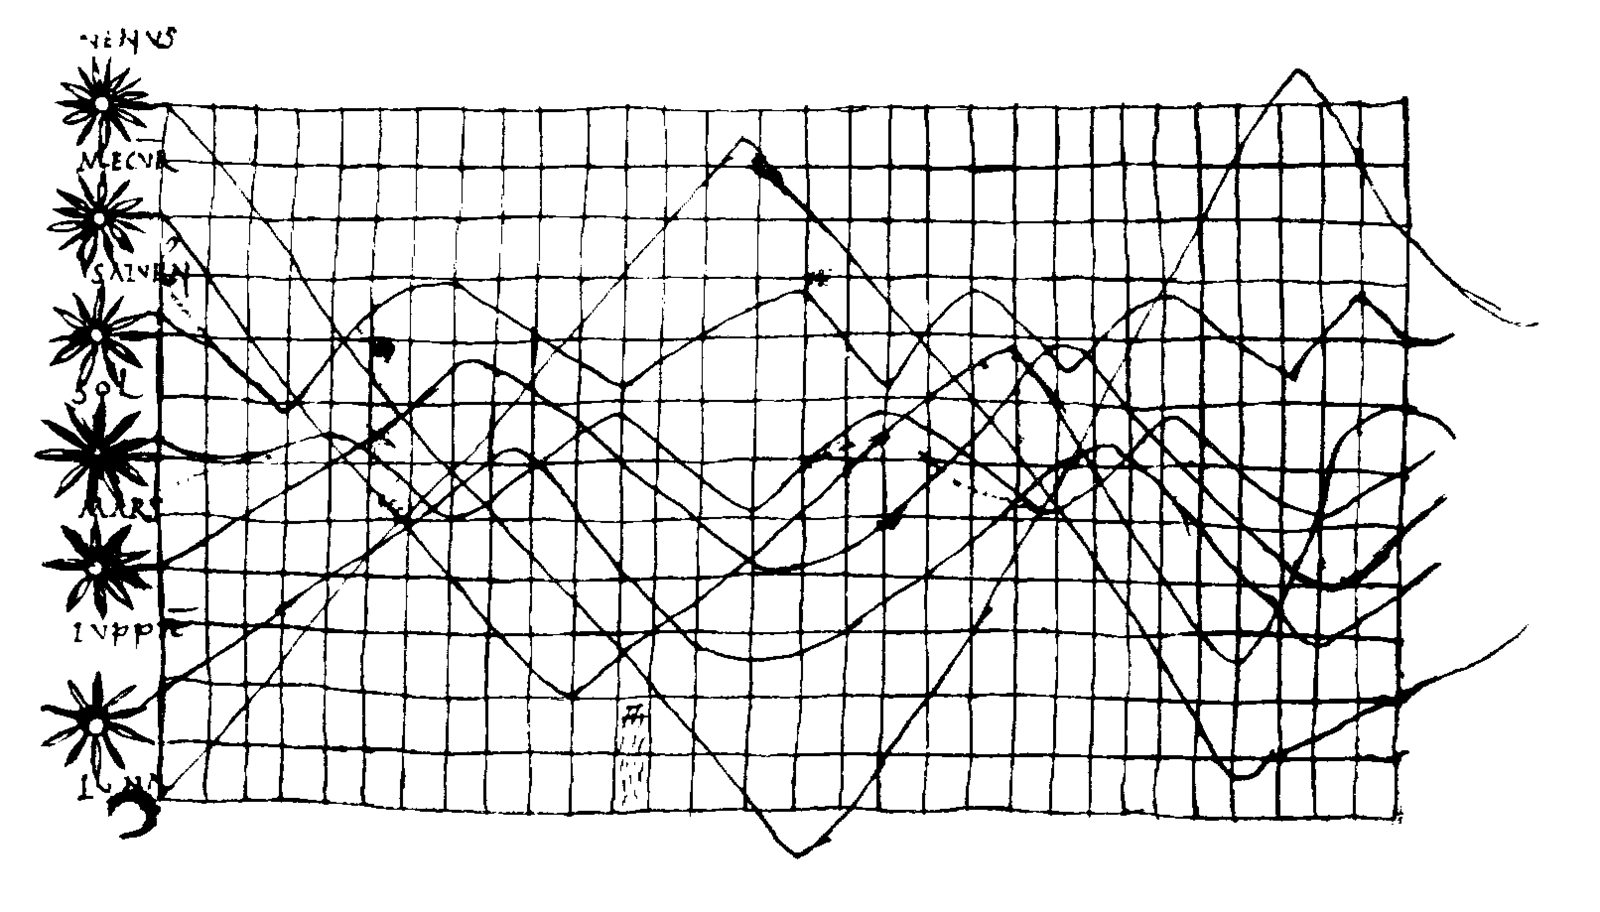
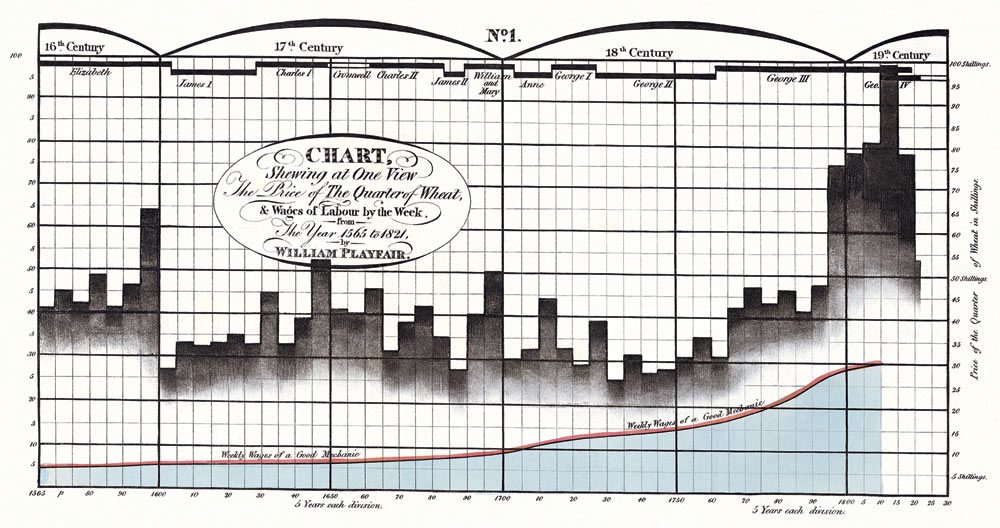
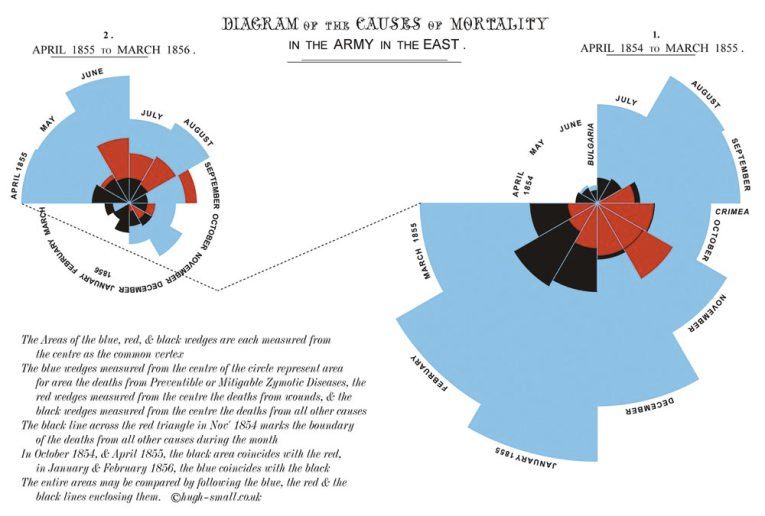
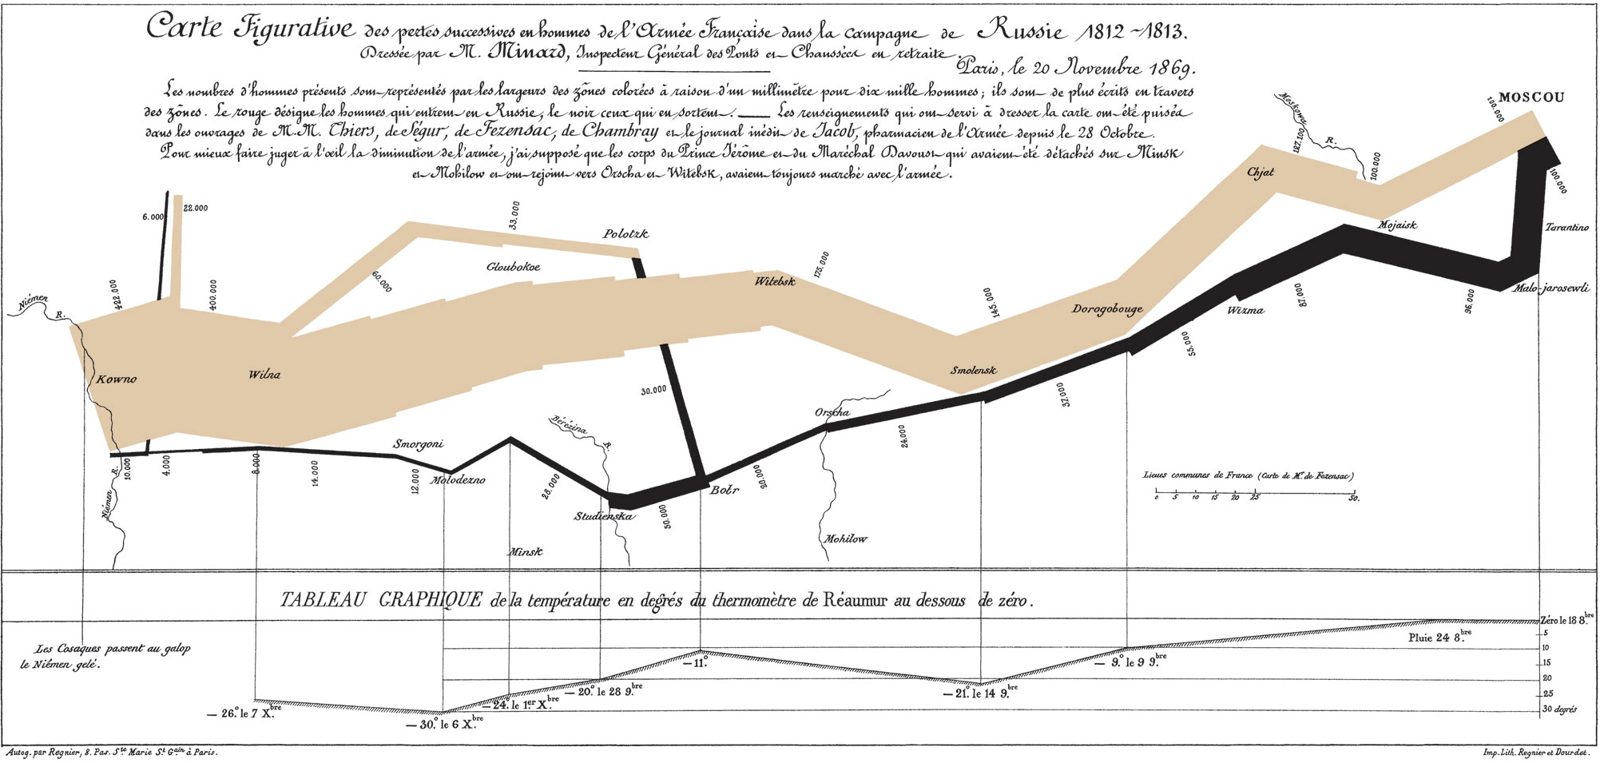
Historische Informationsgrafiken
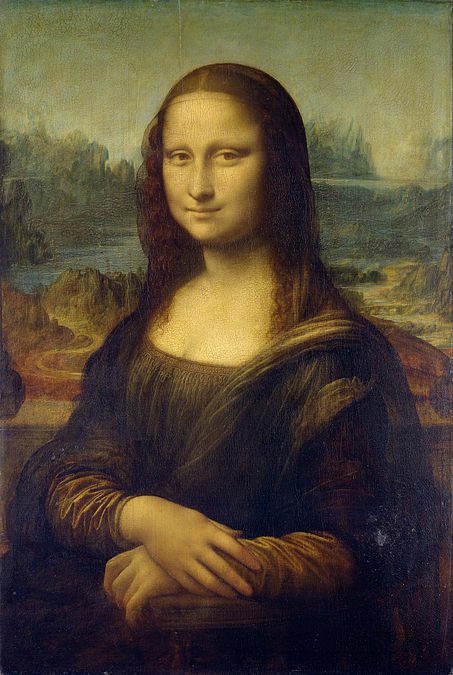
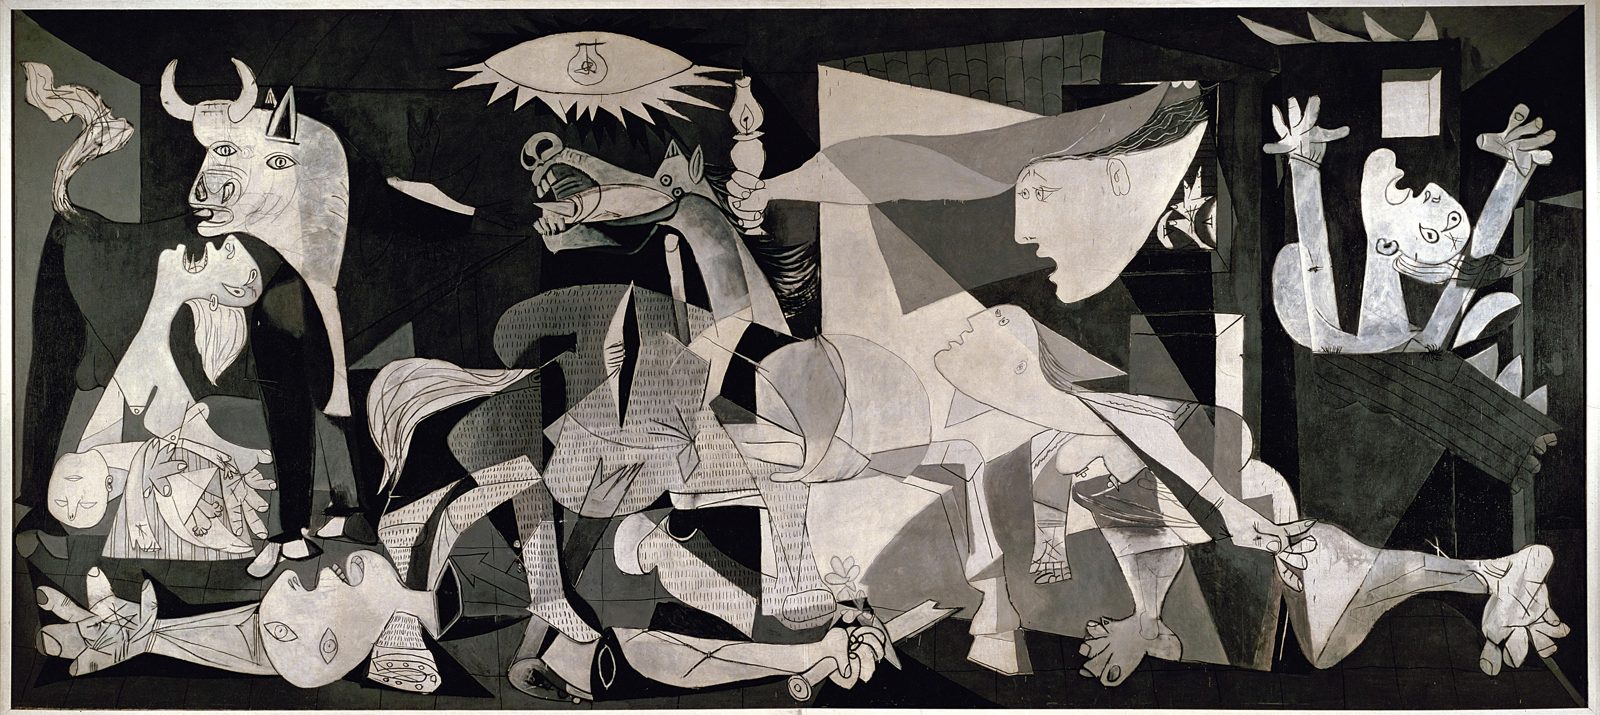
Bilder als Kommunikationsmittel


Motivierendes Beispiel
Statistik vs. Visualisierung
Statistik vs. Visualisierung
| x | y |
|---|---|
| 10,00 | 8,00 |
| 8,00 | 7,00 |
| 13,00 | 9,50 |
| 9,00 | 7,50 |
| 11,00 | 8,50 |
| 14,00 | 10,00 |
| 6,00 | 6,00 |
| 4,00 | 5,00 |
| 12,00 | 9,00 |
| 7,00 | 6,50 |
| 5,00 | 5,50 |
| x | y |
|---|---|
| 10,00 | 8,04 |
| 8,00 | 6,95 |
| 13,00 | 7,58 |
| 9,00 | 8,81 |
| 11,00 | 8,33 |
| 14,00 | 9,96 |
| 6,00 | 7,24 |
| 4,00 | 4,26 |
| 12,00 | 10,84 |
| 7,00 | 4,82 |
| 5,00 | 5,69 |
| x | y |
|---|---|
| 10,00 | 6,95 |
| 8,00 | 8,04 |
| 13,00 | 5,69 |
| 9,00 | 8,81 |
| 11,00 | 4,82 |
| 14,00 | 4,26 |
| 6,00 | 10,84 |
| 4,00 | 9,96 |
| 12,00 | 7,24 |
| 7,00 | 8,33 |
| 5,00 | 7,58 |
| x | y |
|---|---|
| 10,00 | 7,54 |
| 8,00 | 7,45 |
| 13,00 | 5,58 |
| 9,00 | 8,81 |
| 11,00 | 7,33 |
| 14,00 | 7,46 |
| 6,00 | 8,74 |
| 4,00 | 6,76 |
| 12,00 | 9,34 |
| 7,00 | 5,82 |
| 5,00 | 7,69 |
nach Anscombe, 1973
Statistik vs. Visualisierung
Gleiche Mittelwerte – völlig verschiedene Zusammenhänge
Das Anscombe-Quartett
| x | y |
|---|---|
| 10,00 | 8,04 |
| 8,00 | 6,95 |
| 13,00 | 7,58 |
| 9,00 | 8,81 |
| 11,00 | 8,33 |
| 14,00 | 9,96 |
| 6,00 | 7,24 |
| 4,00 | 4,26 |
| 12,00 | 10,84 |
| 7,00 | 4,82 |
| 5,00 | 5,69 |
| x | y |
|---|---|
| 10,00 | 9,14 |
| 8,00 | 8,14 |
| 13,00 | 8,74 |
| 9,00 | 8,77 |
| 11,00 | 9,26 |
| 14,00 | 8,10 |
| 6,00 | 6,13 |
| 4,00 | 3,13 |
| 12,00 | 9,13 |
| 7,00 | 7,26 |
| 5,00 | 4,76 |
| x | y |
|---|---|
| 10,00 | 7,46 |
| 8,00 | 6,77 |
| 13,00 | 12,74 |
| 9,00 | 7,11 |
| 11,00 | 7,81 |
| 14,00 | 8,84 |
| 6,00 | 6,08 |
| 4,00 | 5,39 |
| 12,00 | 8,15 |
| 7,00 | 6,42 |
| 5,00 | 5,73 |
| x | y |
|---|---|
| 8,00 | 6,58 |
| 8,00 | 5,76 |
| 8,00 | 7,71 |
| 8,00 | 8,84 |
| 8,00 | 8,47 |
| 8,00 | 7,04 |
| 8,00 | 5,25 |
| 19,00 | 12,50 |
| 8,00 | 5,56 |
| 8,00 | 7,91 |
| 8,00 | 6,89 |
nach Tufte, 1990
Das Anscombe-Quartett
Identische Kennzahlen, identische Regressionsgerade – vier verschiedene Geschichten
nach Tufte, 1990
Korrelationen im Streudiagramm
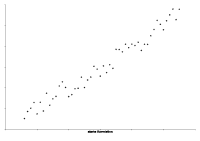
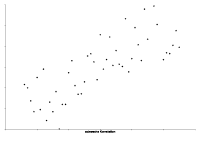
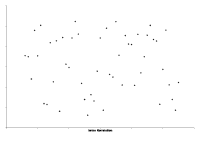
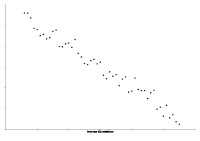
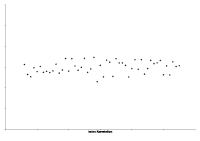
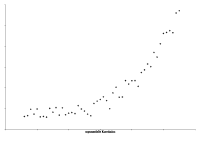
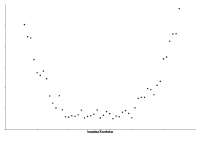
nach Harris, 1996
Ziele der Visualisierung
Interaktive Unterstützung bei
Hearst, 1998
Fragen?